Interested in the interplay of artificial intelligence and neuroscience? Then you don’t want to miss Dr. Matthew Botvinick’s talk on deep reinforcement learning this Tuesday, June 15 at 4pm. Dr. Botvinick is the director of Neuroscience research at DeepMind and an Honorary Professor at the Gatsby Computational Neuroscience Unit at University College London (UCL). He completed his undergraduate studies at Stanford University in 1989, medical studies at Cornell University in 1994, and PhD in psychology and cognitive neuroscience at Carnegie Mellon University in 2001. Dr. Botvinick’s work at DeepMind sits at the boundaries between cognitive science, computational and experimental neuroscience and artificial intelligence. His pioneering work includes studying the role of anterior cingulate cortex in conflict monitoring, and modeling the role of prefrontal cortex in hierarchically structured behavior, working memory, and sequential action.
More recently, Dr. Botvinick has been studying deep reinforcement learning and its neuroscientific applications (Botvinick et al., 2020). Recent advances in AI and machine learning have led to an increased interest in using deep learning to model brain function. Most of these research efforts have focused on deep neural networks trained using supervised learning in tasks such as image classification. More novel developments in AI that may have profound implications in studying brain function, such as deep Reinforcement Learning (RL), have received far less attention from the neuroscience field. Deep RL integrates classic Deep Learning and Reinforcement Learning (Figure 1) .
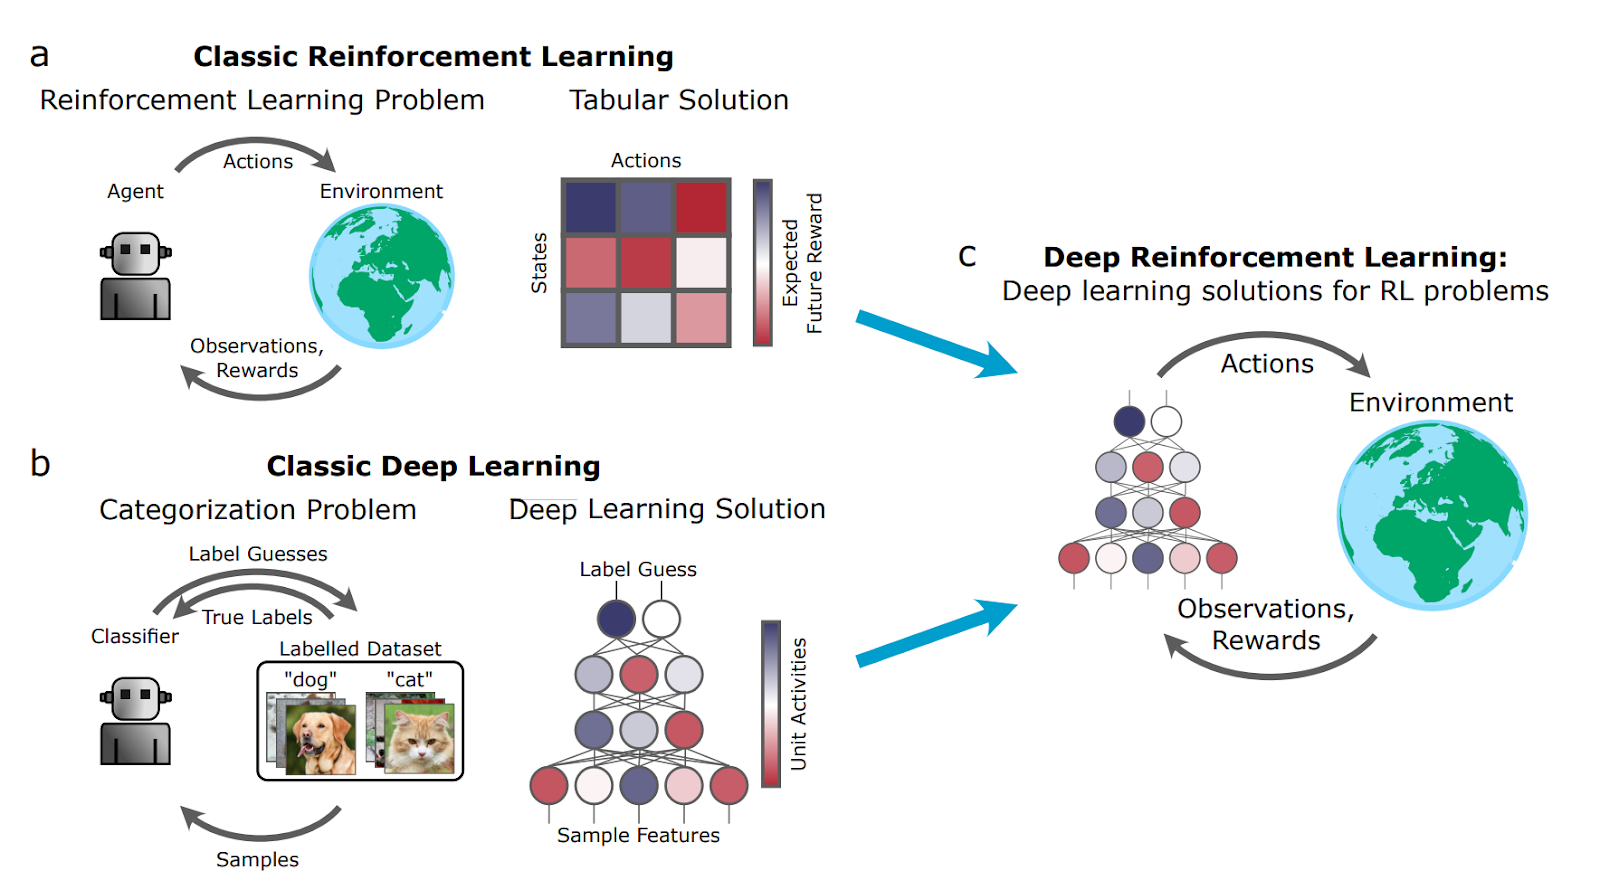
Figure 1. RL, Deep Learning, and Deep RL
Deep learning leverages networks of artificial neurons to perform a task. The nonlinear nature of the neurons allows the network to compute complicated functions for a given input, making the network very adaptable to a wide range of tasks. What ends up making the network really good at one task over another is the numerous connections between neurons in the network. The key innovation of deep learning is the process of algorithmically determining how to adjust the connections between neurons in the network to produce an optimal response for a given set of inputs. Conceptually, there are two main approaches to training deep networks: supervised and unsupervised learning. In supervised learning, the network is given explicit feedback on its performance (whether a given response was correct or incorrect) and uses that information to make adjustments to the connections between neurons. In unsupervised learning, the network is not given any feedback but rather uses an algorithm to autonomously evaluate the inputs and adjust connection weights to capture a “good” representation of them. Deep RL ends up somewhere in the middle of these alternatives by actively providing feedback to the network, without being so explicit that the network loses its autonomy to explore and algorithmically determine the optimal connections.
In Reinforcement Learning, an algorithm is used to produce a reward signal for a given response produced by the network. (Think giving your cat treats as positive reinforcement.) Since the reward is algorithmically generated, the network can learn autonomously and adjust its connections to produce responses that return a greater reward. Additionally, since the network is not told explicitly whether its response was right or wrong, it has the flexibility to explore alternative actions or strategies throughout the learning processes. Integrating algorithmically generated reward signals into deep network architectures so that networks explore and perfect a given task has proven to be a challenging engineering problem.
Recent advances now allow neuroscientists to model neuronal systems within a deep RL framework. This perspective is particularly attractive, as there is evidence that the brain computes reward or prediction signals that guide its activity. A small number of vanguard studies have started to apply deep RL to neuroscientific data. For instance, when trained on a number of similar tasks, deep RL networks are found to adapt to new tasks of the same kind (Wang et al., 2018). The resulting network activity was structured to be flexible so that the network could change its internal activity and subsequent responses to produce good performance on multiple tasks without altering the connections between neurons. This phenomena is in line with neuroscientific theories of prefrontal cortex functioning, such as activity-based working memory.
Deep RL provides an agent-based framework for studying the way reward shapes representation, and how representation in turn shapes learning and decision making. This exploration of deep RL in neuroscience offers exciting new opportunities to better understand brain function. Examples of areas for next-stage research include representation learning, memory, cognitive control, action hierarchies, and social cognition amongst many others. As more applications of deep RL models to neuroscientific data emerge, an additional opportunity for neuroscience research to influence deep RL also arises. New insights into how the brain may implement RL could synergistically give rise to concepts that engineers can implement to advance AI and machine learning.
To learn more about Dr. Botvinick’s research and recent work, join us for his talk on deep reinforcement learning, this Tuesday, 6/15/2021, at 4pm on Zoom.
References
- Botvinick, M., Wang, J. X., Dabney, W., Miller, K. J., & Kurth-Nelson, Z. (2020). Deep Reinforcement Learning and Its Neuroscientific Implications. Neuron, 107(4), 603–616. https://doi.org/10.1016/j.neuron.2020.06.014
- Princeton Neuroscience Institute Website: http://www.princeton.edu/~templeton/Templeton/People.html
- Stanford University Human-Centered Artificial Intelligence Website: https://hai.stanford.edu/people/matthew-botvinick
- Wang, J. X., Kurth-Nelson, Z., Kumaran, D., Tirumala, D., Soyer, H., Leibo, J. Z., Hassabis, D., & Botvinick, M. (2018). Prefrontal cortex as a meta-reinforcement learning system. Nature Neuroscience, 21(6), 860–868. https://doi.org/10.1038/s41593-018-0147-8
Written by Blanca Martin-Burgos, a 1st year student in the Neuroscience PhD Program at UCSD working with the Voytek and Muotri labs.